| CFFI THIS AMERICA |
HISTORY CFFI |
| Release Time |
Comprehensive index |
Release Time |
Comprehensive index |
ReleaseTime |
Comprehensive index |
| 2025-03-21 |
1327 |
One month ago |
1902 |
One year ago |
1640 |
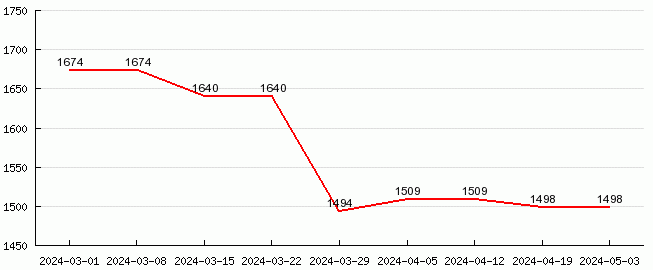
Freight index diagram of China - Australia/New Zealand

Red represents the current periodBlue represents the history data
Port-to-port freight index list of China - Australia/New Zealand this week
HighestLowest
| |
Adelaide |
Brisbane |
Lyttelton |
Melbourne |
Sydney |
| Guangzhou |
1000 |
1050 |
900 |
1050 |
1050 |
| Shenzhen |
0 |
0 |
0 |
0 |
850 |
| Xiamen |
0 |
1900 |
0 |
1900 |
1900 |
| Ningbo |
0 |
0 |
0 |
0 |
0 |
| Shanghai |
0 |
2003 |
0 |
2003 |
2003 |
| Qingdao |
1500 |
570 |
650 |
1500 |
1500 |
| Tianjin |
0 |
850 |
0 |
850 |
0 |
| Dalian |
0 |
0 |
0 |
0 |
0 |