| CFFI THIS AMERICA |
HISTORY CFFI |
| Release Time |
Comprehensive index |
Release Time |
Comprehensive index |
ReleaseTime |
Comprehensive index |
| 2025-03-21 |
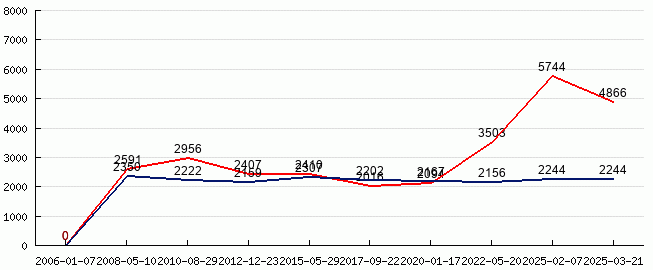
4866 |
One month ago |
5744 |
One year ago |
4324 |
Freight index diagram of China - North America

Red represents the current periodBlue represents the history data
Port-to-port freight index list of China - North America this week
HighestLowest
| |
Houston |
Long Beach |
Montreal |
New York |
Boston |
Chicago |
| Guangzhou |
0 |
0 |
0 |
0 |
0 |
0 |
| Shenzhen |
2300 |
1721 |
2500 |
1650 |
7450 |
2300 |
| Xiamen |
7800 |
1560 |
4000 |
7415 |
7450 |
3960 |
| Ningbo |
2480 |
6502 |
4000 |
2320 |
7450 |
3665 |
| Shanghai |
2500 |
6662 |
3750 |
2500 |
2500 |
2500 |
| Qingdao |
7800 |
1620 |
4000 |
2260 |
2558 |
3825 |
| Tianjin |
0 |
0 |
4000 |
0 |
0 |
0 |
| Dalian |
2593 |
1560 |
7620 |
2508 |
2508 |
4095 |